$7.6 Trillion and Counting: What Goldman Sachs’s AI Infrastructure Forecast Means for the World’s Next Decade
Goldman Sachs projects $7.6 trillion in cumulative AI capital expenditure from 2026 to 2031 — roughly 25% of annual US GDP — split across compute, data centres, and power infrastructure. This essay examines what that scale of private capital allocation signals about the structural forces reshaping technology, energy, and global economic strategy over the next decade.
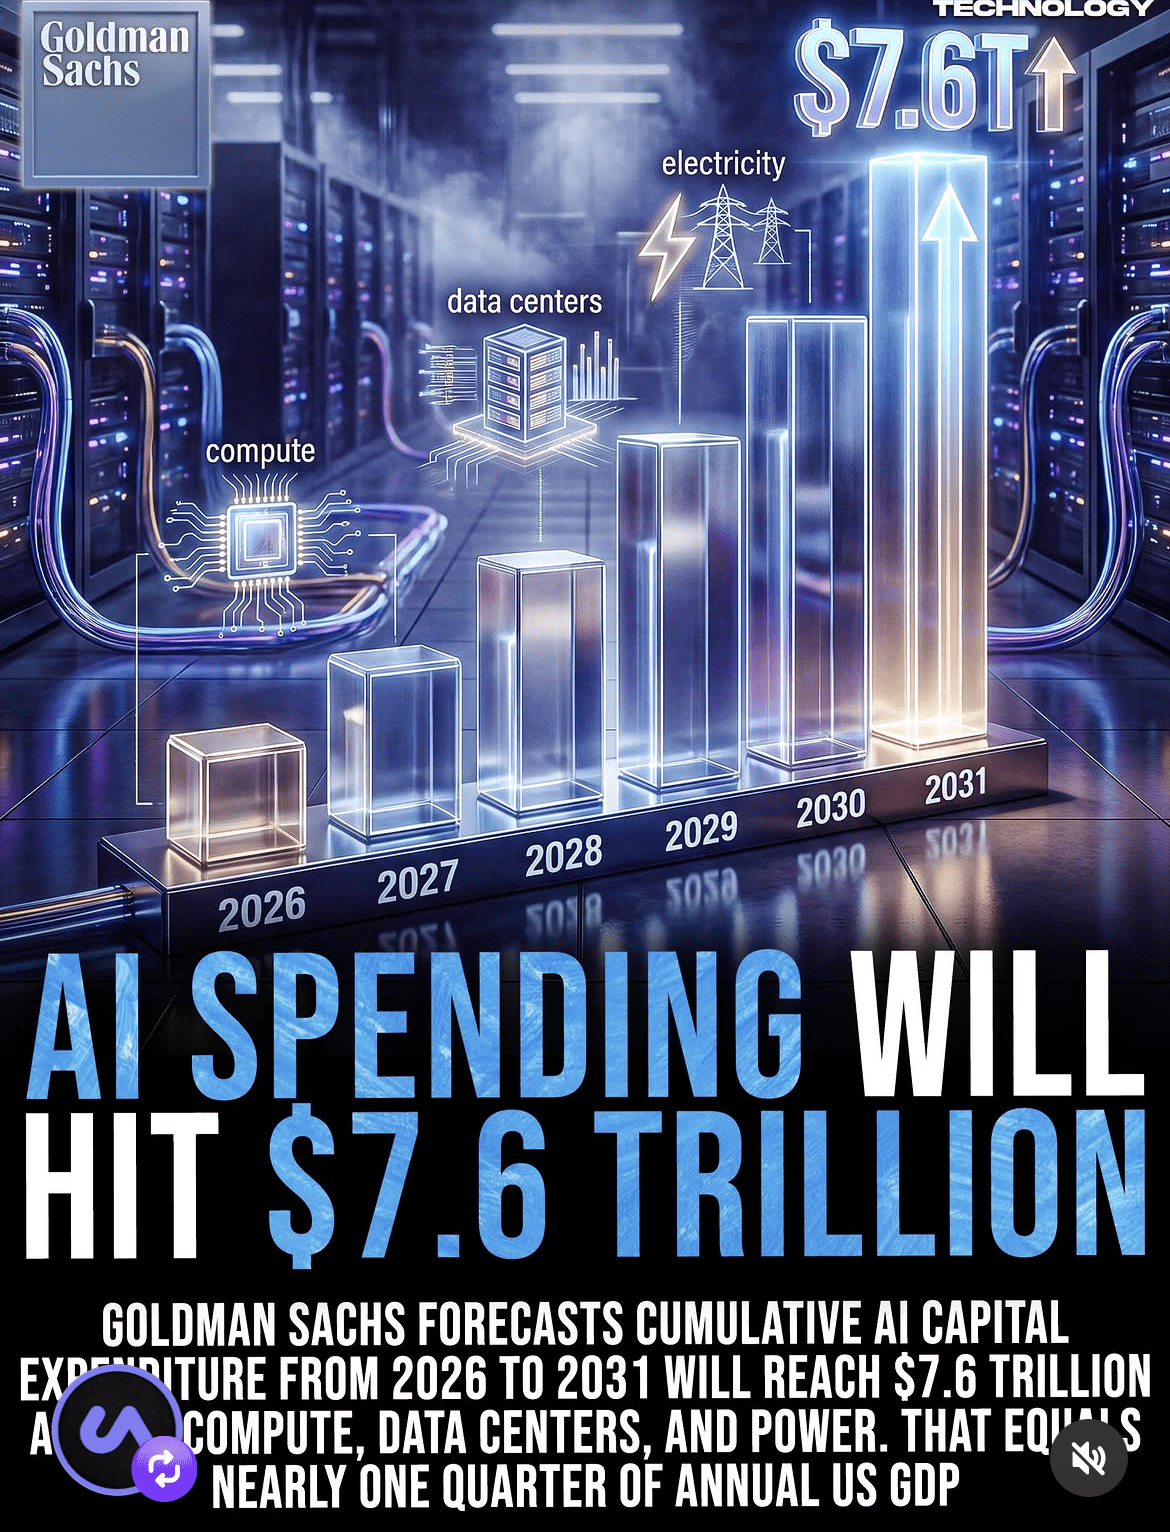
There is a number circulating in financial and technology circles that deserves more than a passing glance. A recent Goldman Sachs infographic, widely shared across professional networks, puts cumulative AI capital expenditure from 2026 to 2031 at $7.6 trillion. To make that number land, the infographic offers a comparison that is almost unsettling in its scale: that figure equals nearly one quarter of the United States’s entire annual GDP.
Stop and sit with that for a moment. The world’s largest economy produces roughly $28 trillion in output every year. Goldman Sachs is projecting that the AI infrastructure buildout — across compute, data centers, and electricity — will consume the equivalent of a full quarter of that output over just six years. This is not a technology trend. This is a civilisational reallocation of capital.
The Three Pillars of a $7.6 Trillion Bet
The Goldman Sachs forecast does not treat AI spending as a monolith. The infographic breaks the investment thesis into three distinct categories, each illustrated with its own icon on the bar chart: compute, data centers, and power (electricity). That taxonomy is worth examining closely, because it tells you something important about where the money is actually going.
Compute refers to the semiconductor and chip layer — the GPUs, TPUs, and custom silicon that train and run AI models. Data centers are the physical infrastructure that houses this compute: the server racks, cooling systems, and network fabric that must be built, often from scratch, to meet demand projections. And electricity is the resource that powers all of it — a category that barely featured in technology investment conversations a decade ago but is now so significant it earns its own line item in a Goldman Sachs forecast.
This three-part framing is a signal. When a major investment bank categorises power infrastructure alongside chips and servers in an AI capital expenditure projection, it is telling you that the energy grid is no longer a utility backdrop to the AI story. It is a core constraint and therefore a core investment opportunity.
The Shape of the Curve Matters as Much as the Number
The bar chart at the centre of the infographic is not a straight line. It shows a dramatic upward trajectory — modest spending in 2026, with each subsequent year growing significantly, and the 2031 bar drawn with a glowing arrow that appears to break through the top of the frame. The design choice is deliberate: the arrow suggests that even the 2031 figure may be a conservative floor, not a ceiling.
This exponential shape has strategic implications that go beyond what the headline number captures. It means that the majority of this $7.6 trillion is not being spent uniformly across six years. The investment is backloaded. The infrastructure being planned and financed today — the land acquisitions, the power purchase agreements, the chip orders — is designed to support spending levels in 2029, 2030, and 2031 that dwarf what is being deployed right now.
For anyone trying to understand the competitive dynamics of the AI industry, this matters enormously. The companies and geographies that secure the infrastructure inputs early — the land, the water rights, the grid connections, the semiconductor supply — will be in a structurally different position by the end of this decade than those who move late. Infrastructure has long lead times. You cannot decide in 2030 that you want the power capacity you should have contracted in 2025.
Why the GDP Framing Is the Most Important Part of This Story
Numbers at the scale of trillions are cognitively difficult. The human brain does not have an intuitive grasp of the difference between one trillion and seven trillion in the way it can grasp the difference between one thousand and seven thousand. The Goldman Sachs communication team clearly understood this, which is why the GDP comparison is the rhetorical anchor of the entire infographic.
Saying that AI capital expenditure will equal approximately 25 to 27 percent of annual US GDP over six years reframes the conversation entirely. It moves the discussion from “technology companies are spending a lot on AI” to something far more consequential: this is one of the largest coordinated capital allocation events in modern economic history.
For context, consider what other large-scale investment programmes have looked like in historical terms. The Marshall Plan, which rebuilt post-war Europe, cost approximately $13 billion at the time — around $160 billion in today’s money. The US Interstate Highway System, one of the largest public infrastructure programmes ever undertaken, cost roughly $500 billion in today’s dollars over its construction period. The Apollo programme cost around $280 billion in today’s money. None of these comes close to the scale Goldman Sachs is projecting for AI infrastructure over a single six-year window.
This does not mean the comparison is straightforward — those were largely public programmes with direct societal mandates, while AI CapEx is driven by private capital chasing commercial returns. But the order of magnitude comparison is still instructive. We are in territory where the private sector is deploying capital at a pace and scale that historically only national governments mobilised for wartime production or post-crisis reconstruction.
What This Means for Professionals Watching AI from Any Vantage Point
If you work in technology, finance, policy, or any adjacent field, the Goldman Sachs forecast is not background noise. It is a structural signal with direct relevance to how you should be thinking about the next five years.
For technology professionals, the implication is that the infrastructure layer of AI — compute, data centres, power — will see sustained investment regardless of which AI model or application wins in any given year. The picks-and-shovels principle applies here: whoever supplies the physical substrate for this buildout is in a defensible position even as the application layer remains volatile and competitive.
For finance and investment professionals, the forecast represents Goldman Sachs putting its analytical weight behind the view that AI infrastructure is not a bubble waiting to correct but a multi-year capital cycle with identifiable spending categories. That is a materially different posture than treating AI as speculative.
For policy professionals and regulators, the numbers raise questions that go beyond any single company or country. If $7.6 trillion is flowing into compute, data centres, and power over six years, the geographic distribution of that investment — and the regulatory, labour, and environmental conditions that shape it — becomes a matter of national strategic interest for virtually every significant economy in the world. Countries that attract even a fraction of that data centre and power infrastructure investment will gain structural advantages in AI capability that compound over time.
For Indian professionals specifically, the question worth asking is where this capital formation intersects with India’s own infrastructure, talent, and policy trajectory. The source data does not provide a regional breakdown, so no India-specific numbers can be responsibly cited here. But the global forecast sets the frame: if the infrastructure buildout of this scale is underway, the decisions being made right now about land, power, semiconductor policy, and data governance will determine which economies are positioned to participate in that capital flow — and which are not.
The Arrow Breaking Through the Chart
There is something worth noting about the visual language Goldman Sachs chose for this infographic. The 2031 bar does not simply reach the top of the chart. It breaks through it, with a glowing upward arrow implying that the trajectory continues beyond what the chart can contain. That is not a neutral design choice. It is an editorial statement: the bank believes the forecast may be conservative.
Whether that proves true depends on variables that no model can fully account for — geopolitical shocks, energy grid constraints, regulatory interventions, or a fundamental shift in what AI can actually deliver commercially. But the direction of the signal is clear. Goldman Sachs is not hedging toward moderation. It is projecting acceleration.
The $7.6 trillion figure is not a prediction about AI’s capability. It is a prediction about human behaviour — specifically, the behaviour of the corporations, sovereign funds, and institutional investors who have decided, in sufficient numbers and with sufficient conviction, that building out AI infrastructure at civilisational scale is worth doing. Understanding why they believe that, and what it means for the systems and industries around you, is one of the more important analytical tasks of this decade.